The Period at a Glance
Commercial real estate is the core of what we do. From April 1 through September 30, 2026, 40 commercial properties closed in Luzerne County through the multiple listing service, against 41 over the same six months of 2025. The median sale price was ($295,000), up from ($279,000), and total sale volume was about ($16.0 million), against ($21.1 million) a year earlier, when a single ($6.2 million) sale accounted for nearly a third of the volume. This period's largest sale, ($3.55 million) for a business property in Wilkes-Barre Township, was about a fifth of it.
Properties sold much faster but at a slightly deeper discount. The median property sold for (89.4%) of its final list price, against (90.4%), and spent a median of 49.5 days on the market, against 77. None of the period's commercial sales closed above asking.
The second quarter of 2026 produced 16 sales and the third quarter 24, both at a median of ($295,000).
Sales by Price Band
| Price Band | Closed Sales | Share |
|---|---|---|
| Under $200,000 | 11 | 28% |
| $200,000 To $500,000 | 23 | 58% |
| $500,000 To $1,000,000 | 4 | 10% |
| $1,000,000 Or More | 2 | 5% |
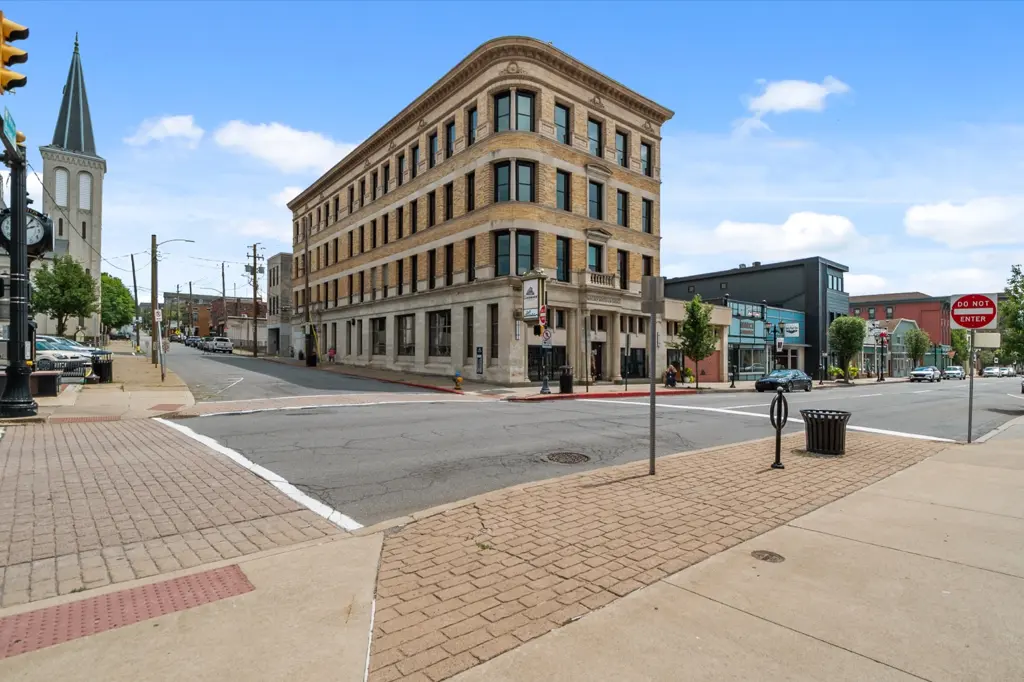
34 of the 40 sales, (85%), closed under ($500,000), and the ($200,000) to ($500,000) band alone held more than half. That is the profile of an owner-user and local investor market, Main Street storefronts, mixed-use buildings, small offices and business properties, rather than institutional assets. Two sales reached ($1 million), the Wilkes-Barre Township business property and an industrial building in Duryea at ($1.0 million).
What Kind of Commercial Property Sold
| Property Type | Closed Sales | Median Sale Price |
|---|---|---|
| Business | 14 | $280,500 |
| Mixed Use | 14 | $335,625 |
| Office | 3 | Too Few to Publish |
| Industrial | 2 | Too Few to Publish |
| Warehouse | 1 | Too Few to Publish |
| Not Classified by the Listing Agent | 6 | $162,500 |
Business properties and mixed-use buildings, typically retail on the ground floor with apartments above, made up 28 of the 40 sales, and mixed use again carried the higher median of the two. By location, Wilkes-Barre led with 11 sales, followed by Hazleton with 4. No other town had more than two, and only Wilkes-Barre had enough to suggest a local market of its own.
The Industrial Backdrop
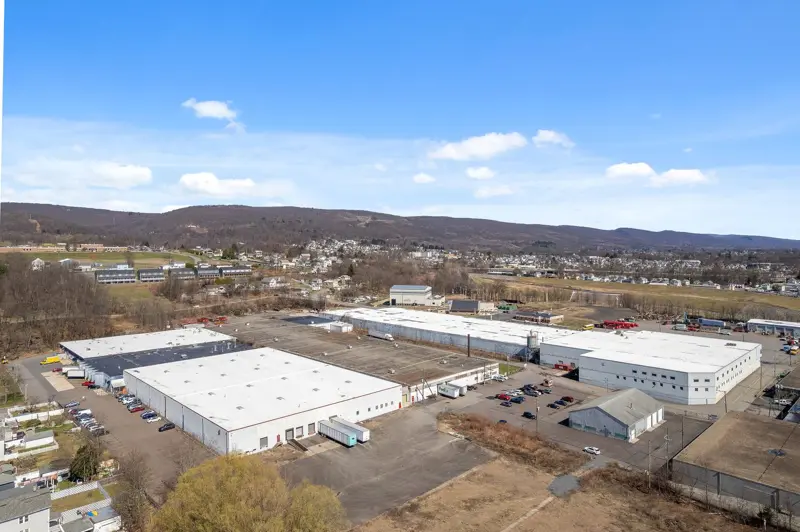
The for-sale market above is only part of the commercial picture. The larger story in Greater Pittston and the broader NEPA submarket is industrial. Cushman & Wakefield put Northeastern Pennsylvania industrial vacancy at (6.9%) at the end of September, down from (7.1%) at the end of June, as the submarket absorbed 383,600 square feet in the third quarter and the space under construction more than doubled to about 5.5 million square feet. For the same quarter, Lee & Associates reported that vacancy across its six-submarket region from Central Pennsylvania to Delaware rose to (8.39%) as 11 buildings delivered, with nearly (80%) of their combined space vacant, while net absorption stayed positive at 3.6 million square feet. Lee noted that vacant speculative deliveries and tenant givebacks affected the Lehigh Valley and Northeastern Pennsylvania. Nationally, Cushman & Wakefield put third-quarter vacancy at (6.8%).
Our NEPA Industrial Market Outlook for the same six months covers those figures in detail. They matter here because the jobs, traffic and investment that industrial growth brings are what support demand for the office, retail and mixed-use property that trades through the MLS.
The Surrounding Counties
Commercial sales in Lackawanna, Wyoming, Monroe and Carbon recorded in our MLS during the period were too few to publish a reliable median, so we do not. What is true across the region is that commercial value is driven by income, not by comparable sales alone. Any commercial property, in any of these counties, is best evaluated on its own income and lease structure rather than against a countywide figure.
How Commercial Property Is Actually Valued
A median sale price is a useful orientation figure, but it is not how a commercial property is valued. Value is driven by income, the net operating income a property produces, the strength and length of its leases, the quality of its tenants, and the capitalization rate a buyer applies to that income. Two buildings at the same price can be worth very different amounts depending on whether they are fully leased to strong tenants or sitting half vacant. That is why every commercial deal we advise on starts with the rent roll and the expense structure, not the list price.
Methodology and Sources
Every figure in this report is a closed commercial sale recorded in the Luzerne County Association of REALTORS® multiple listing service with a close date from April 1 through September 30, 2026, across all listing brokerages. The comparison period is April 1 through September 30, 2025. Commercial leases are excluded. A property the listing agent entered twice under two property types is counted once. Nominal transfers recorded under ($1,000) are excluded. Property types are as entered by the listing agent. Industrial context is drawn from the published research named below.
- Luzerne County Association of REALTORS® multiple listing service, closed commercial sales, April 2025 through September 2026, retrieved October 15, 2026 and re-checked October 20, 2026
- Cushman & Wakefield, PA I-81 / I-78 / I-81S Industrial MarketBeat, Q3 2026, and PA I-81 / I-78 Industrial MarketBeat, Q2 2026 (preliminary)
- Lee & Associates of Eastern Pennsylvania, Q3 2026 Industrial Market Report release (October 14, 2026)
- Cushman & Wakefield, U.S. Industrial MarketBeat, Q3 2026
Talk to a Local Broker Who Knows This Market
Jonathan J. Nelson Real Estate works the Greater Pittston and NEPA market every day, handling residential and commercial sales, as well as investment guidance and property management. If you are buying, selling, or investing, let's talk.
Contact Jonathan J. Nelson Real Estate